Analytics
The Analytics feature provides powerful insights into your candidate pool, allowing you to filter and segment candidates across multiple dimensions. Use these data-driven filters to quickly narrow down your search results and identify the most relevant candidates based on company, experience, education, location, and more.
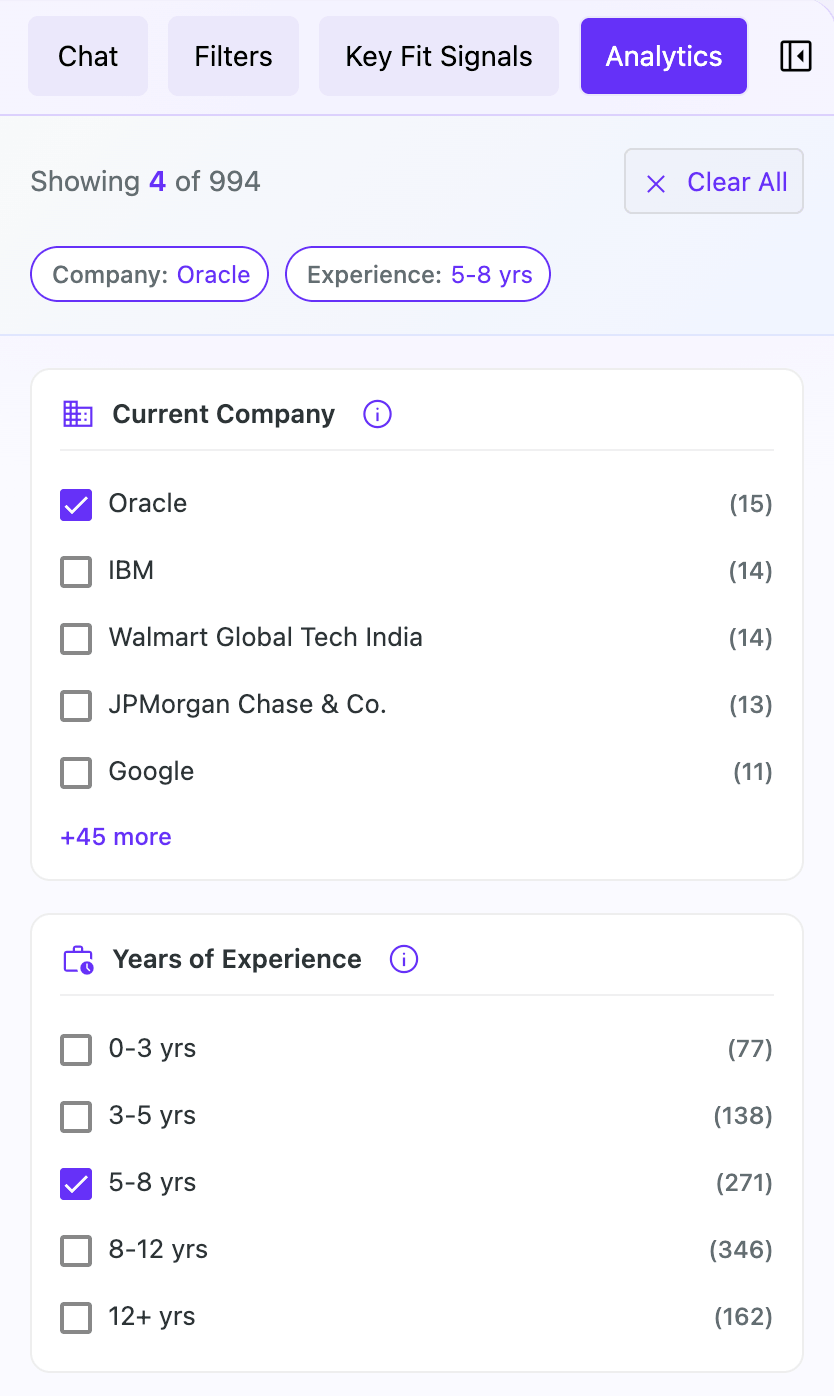
1. Analytics Panel Overview
The Analytics panel displays aggregated data about your search results and provides interactive filters to refine your candidate pool.
| Section | Description | Action |
|---|---|---|
| Profile Count | Shows the total number of profiles available or filtered count when filters are active (e.g., “Showing 45 of 200”). | Monitor how your filters affect the candidate pool size. |
| Clear All Button | Appears when one or more filters are active. | Click to reset all analytics filters and return to the full candidate pool. |
| Active Filters Bar | Displays all currently applied filters as chips showing dimension and value. | Review which filters are currently narrowing your results. |
| Filter Dimensions | Expandable sections for each data dimension (Company, Experience, etc.). | Check/uncheck options to filter candidates by specific criteria. |
| Show More/Less | Link that appears when a dimension has more than 5 options. | Click to expand and see all available filter options. |
2. Filter Dimensions
Each dimension allows you to filter candidates based on specific attributes. Select one or more options within each dimension to narrow your results.
| Dimension | Description | Example Values |
|---|---|---|
| Current Company | Filter by the candidate’s current employer. Company logos are displayed when available. | Google, Microsoft, Amazon, Meta |
| Years of Experience | Filter by total years of professional experience using predefined ranges. | 0-2 years, 3-5 years, 6-10 years, 10+ years |
| Universities | Filter by educational institutions attended. University logos are displayed when available. | Stanford, MIT, Harvard, UC Berkeley |
| Average Tenure | Filter by average time spent at previous companies, indicating job stability patterns. | Less than 1 year, 1-2 years, 2-4 years, 4+ years |
| Location | Filter by the candidate’s geographic location. | San Francisco, New York, Austin, Remote |
| Engagement Level | Filter by candidate engagement signals and openness to new opportunities. | High, Medium, Low |
| Layoff Status | Filter by layoff information from the candidate’s company, identifying those actively seeking opportunities. | Affected by layoffs, Not affected |
Understanding Filter Logic
Analytics filters use a combination of OR and AND logic to give you flexible control over your results:
| Logic Type | How It Works | Example |
|---|---|---|
| OR (Within Dimension) | Selecting multiple options within the same dimension shows candidates matching ANY of those options. | Selecting “Google” and “Microsoft” under Current Company shows candidates from either company. |
| AND (Across Dimensions) | Filters from different dimensions are combined, showing only candidates that match ALL selected dimensions. | Selecting “Google” under Company AND “5-10 years” under Experience shows only Google employees with 5-10 years of experience. |
Tip: Use filters across multiple dimensions to narrow down to your ideal candidates. Filters within a category use OR logic, while filters across categories use AND logic.
3. Using Analytics Filters
Follow these steps to effectively filter your candidate pool:
| Step | Action | Result |
|---|---|---|
| 1. Review Dimensions | Scroll through the Analytics panel to see available filter options and their counts. | Understand the composition of your candidate pool. |
| 2. Select Filters | Check the checkbox next to any filter option you want to apply. | Candidates matching that criteria will be highlighted/filtered. |
| 3. Expand Options | Click “+X more” to see additional options when a dimension has more than 5 values. | Access the full list of available filter values. |
| 4. Monitor Results | Watch the profile count at the top to see how filters affect your pool size. | Ensure you’re not over-filtering and missing good candidates. |
| 5. Review Active Filters | Check the active filters bar to see all applied filters at a glance. | Keep track of your current filter configuration. |
| 6. Clear Filters | Click “Clear All” to remove all filters, or adjust individual checkboxes. | Start fresh or fine-tune your filtering strategy. |
4. Dimension Details
Current Company
Filter candidates by their current employer company. This is useful when targeting candidates from specific organizations or industries. Company logos are automatically displayed when available to help with quick identification.
Years of Experience
Filter candidates by their total years of professional experience. Experience ranges help you find candidates with the right level of expertise for your role, whether entry-level or senior positions.
Universities
Filter candidates by their educational institutions. This helps identify candidates from specific schools, programs, or academic backgrounds that align with your requirements.
Average Tenure
Filter candidates by their average time spent at previous companies. This metric helps identify candidates with stable employment history versus those who change roles more frequently.
Location
Filter candidates by their geographic location. Select specific cities or regions to find candidates in your target areas, whether for on-site, hybrid, or location-specific remote roles.
Engagement Level
Filter candidates by their engagement signals and openness to opportunities. Higher engagement levels indicate candidates who are more likely to respond positively to outreach.
Layoff Status
Filter candidates based on layoff information from their companies. This helps identify candidates who may be actively seeking new opportunities due to recent or ongoing company layoffs.
Best Practices
- Start broad, then narrow – Begin with one or two filters and progressively add more based on initial results
- Check filter counts – Use the count numbers next to each option to understand the distribution of candidates
- Combine with other tabs – Use Analytics filters alongside Key Fit Signals and Filters for comprehensive candidate screening
- Monitor pool size – Keep an eye on the “Showing X of Y” indicator to avoid over-filtering
- Use engagement signals – Prioritize candidates with higher engagement levels for better response rates
- Consider layoff status – Candidates affected by layoffs may be more responsive to outreach
Tip: The Analytics panel updates in real-time as you apply filters. Use this to quickly experiment with different filter combinations and find the optimal candidate pool for your search.